The Night I Watched My Savings Evaporate: The Reality of Market Storms
Watching your hard-earned savings shrink during a sudden market crash is one of the worst feelings in the world. But here is the truth: you do not have to blindly guess when the next storm is coming. By learning to read a few simple signs, you can spot the warning clouds before the heavy rain ruins your portfolio. Let's look at how I protect my own money using basic market signals you can start tracking today.
That painful night taught me that the stock and crypto markets do not care about our dreams. When a storm hits, it hits hard, leaving unprepared investors in total shock. I realized that hoping for the best is simply not a real strategy when your financial future is on the line.
You start to question every single decision you made and wonder if you should just sell everything. This fear often leads to selling at the worst possible time, locking in heavy losses. It is an exhausting cycle that destroys both your bank account and your happiness.
But it does not have to be this way if you learn how to read the weather of the financial world. By understanding a few simple signals, you can spot the clouds before the heavy rain starts to fall. Let us look at how you can take back control of your financial journey.
🛑 Quick Reality Check: Market Myth vs. Fact
- The Myth: You need to be a Wall Street genius with expensive computers to predict a market crash.
- The Fact: The best warning signs—like the VIX index and the 200-day moving average—are completely free and easy for anyone to track in just ten minutes a week.
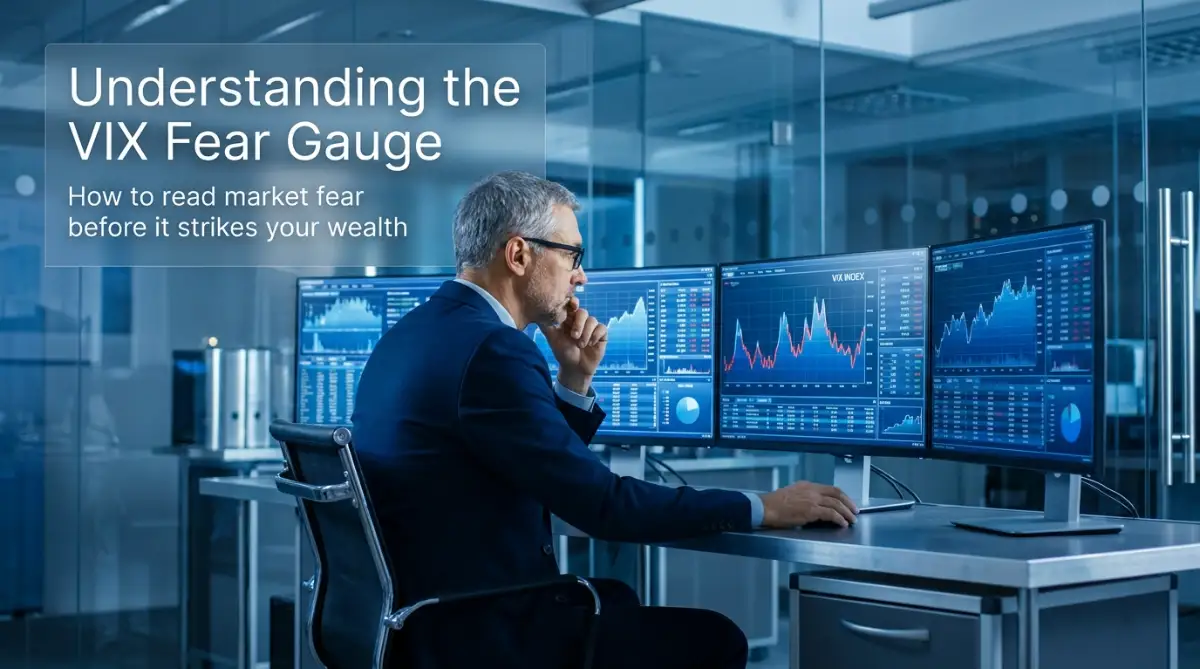
⚡ Quick Guide: How to Spot a Market Storm Early
- Watch the VIX: If the Volatility Index goes over thirty, panic is spreading. It is usually wise to hold onto your cash.
- Mind the 200-Day Line: When asset prices drop below the 200-day simple moving average, it is a clear warning that the long-term trend has turned weak.
- Follow the Smart Money: Keep an eye on trading volume spikes and widening credit spreads in the bond market to see if big institutions are quietly running for the exits.
- Build a Buffer: Always keep a solid cash reserve so you never have to sell your long-term investments in a panic to cover daily expenses.
Your Survival Guide: Top Signals That Show Market Troubles Are Coming
The Fear Gauge: Reading the Volatility Index (VIX)
To understand where the market is going, you must first look at how scared other investors are. The Volatility Index, widely known as the VIX, is an excellent tool for measuring this fear in real-time. It acts like a thermometer for the stock market, showing when tempers are rising.
When the VIX is low, it means investors are calm and confident about the future. However, when the VIX spikes rapidly, it shows that panic is beginning to spread through the trading floor. Long-term investors watch this number closely to prepare for sudden price swings.
For example, a VIX reading above thirty usually points to extreme fear and massive price movements. If you see this happen, it might be time to hold onto your cash instead of buying new assets. It tells you that a storm is already here, and you should seek shelter.
To make this easy for you, here is a simple cheat sheet I use to read the VIX:
The Heavy Weight: Tracking Major Moving Averages
Another excellent way to cut through the daily noise is by looking at long-term price trends. The two-hundred-day simple moving average is one of the most reliable indicators you can use. It smooths out the daily ups and downs to show you the true direction of an asset.
Think of it as a massive ship moving through the ocean. It takes a lot of force to turn a giant ship around, and the same goes for a major market trend. If the price of an asset falls below this line, it is a clear warning sign.
Many professional traders use this line as a line in the sand for their portfolios. When the market stays above this average, the path of least resistance is usually upward. But once it breaks below, it often triggers a wave of panic selling that you want to avoid.
I used to ignore this moving average because I thought it was too simple to be useful. That mistake cost me thousands of dollars when a major stock fell below the line and kept crashing. Now, I always check this indicator before making any big long-term moves.
The Sudden Rush: Watching Trading Volume Spikes
Price changes on their own do not always tell the whole story of what is happening. To understand the strength behind a price move, you must look at the volume of trades. Trading volume tells you how many shares or coins are changing hands during a specific period.
If a price drops on very low volume, it might just be a temporary blip on the radar. But if the price crashes on massive volume, it means big institutional players are rushing for the exits. This sudden surge in volume shows strong conviction behind the downward move.
You can think of volume as the fuel that powers a market trend. High volume means the trend has plenty of power behind it and is likely to continue. Low volume suggests the movement is weak and could reverse at any moment.
The Bond Market Signal: Credit Spreads Explained
Most stock and crypto investors completely ignore the bond market, which is a major mistake. The bond market is often much smarter than the stock market when it comes to spotting economic trouble. One key area to watch is the difference in yields between safe and risky bonds.
This difference is called a credit spread, and it shows how much extra interest risky companies must pay. When times are good, risky companies can borrow money relatively cheaply because lenders are not worried. But when fear creeps in, lenders demand much higher interest rates to cover the risk.
A widening credit spread is a clear signal that banks and big institutions are getting nervous. If they are hesitant to lend money to businesses, the wider economy will feel the pain soon. Tracking this indicator gives you an early warning before the stock market even reacts.
The Cost of Money: Interest Rates and Central Bank Policies
Central banks hold incredible power over how money flows through the global financial system. When central banks raise interest rates, they make borrowing money more expensive for everyone. This move is designed to cool down high inflation, but it also slows down economic growth.
Higher rates mean that businesses spend less on expansion and consumers buy fewer goods. This shift directly impacts company profits, which eventually drags down stock prices. It also makes safe assets like savings accounts more attractive than risky stocks or crypto.
As a long-term investor, you must stay aware of what central banks are planning to do. If they keep raising rates, you can expect higher market volatility to stick around for a while. It is wise to adjust your risk level when the cost of money is rising fast.
A Closer Look at Volatility Mechanics
Understanding the math behind these price swings can help you stay calm during market storms. This simple video explains the core concepts of market volatility and how you can use them to your advantage.
To see these indicators in action and understand how to read them like a pro, watch this highly educational guide.
[Insert YouTube Video Link Here]
Now that you have watched the basic mechanics, let us explore another major indicator that many retail investors miss. This next tool helps you see what is happening behind the scenes in the options market.
The Put-Call Ratio: Gauging Market Sentiment
The options market is where big players place bets on whether prices will go up or down. A put option is a bet that prices will fall, while a call option is a bet they will rise. By comparing these two, you get a clear picture of what the smart money is doing.
When the put-call ratio is very high, it means more people are buying protective puts than calls. This high ratio shows that the market is filled with fear and people are hedging their bets. It often signals that we are close to a market bottom because everyone is already bearish.
On the other hand, an extremely low ratio means investors are overly confident and greedy. When everyone assumes the market can only go up, it creates a dangerous environment where sudden drops can happen. Monitoring this ratio helps you avoid buying at the absolute peak of a market bubble.
The Impact of Economic Data Releases
Financial markets do not move in a vacuum; they react heavily to real-world economic data. Reports on inflation, employment numbers, and manufacturing output can cause immediate and massive price swings. If these numbers turn out worse than expected, panic can set in very quickly.
For instance, a sudden rise in unemployment shows that businesses are struggling and consumers will soon spend less money. This chain reaction hurts corporate earnings and causes investors to pull their money out of risky assets. Knowing when these reports are scheduled helps you prepare for short-term price swings.
You do not need to be an economist to understand these reports. Simply watching whether the actual numbers match what experts predicted is enough to guide your decisions. Consistent disappointments in economic data are a strong sign that a prolonged market downturn is on the horizon.
The Yield Curve Inversion: The Ultimate Recession Warning
One of the most famous and accurate predictors of economic trouble is the yield curve. Normally, long-term bonds pay higher interest rates than short-term bonds because you are locking your money away longer. This makes perfect sense because more time equals more risk for the lender.
However, sometimes short-term interest rates rise above long-term rates, which is called an inversion. This unusual event shows that investors have very little confidence in the near-term economic outlook. Historically, a yield curve inversion has predicted almost every major recession with incredible accuracy.
While a recession might not happen immediately after the inversion, it usually arrives within one to two years. For long-term investors, this is the ultimate signal to start cleaning up your portfolio. It tells you that the economic cycle is maturing and storm clouds are gathering.
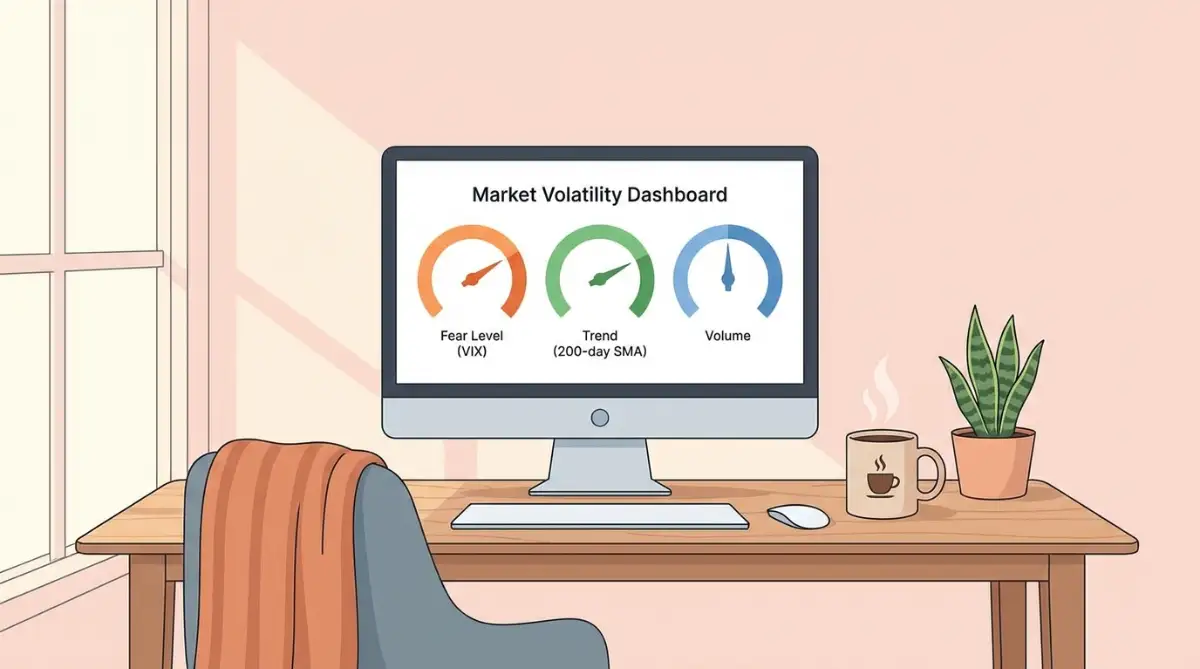
How to Build a Volatility Dashboard for Your Portfolio
Now that you know the key indicators, you need a simple way to track them without getting overwhelmed. You do not need expensive software or a degree in finance to do this effectively. A simple spreadsheet or a free financial website can hold all the data you need.
Try to check these indicators once a week rather than every single day. Looking at them daily will only feed your anxiety and lead to emotional decision-making. Weekly checks allow you to see the bigger picture and spot meaningful trends over time.
By spending just fifteen minutes a week updating your list, you can stay ahead of the crowd. You will start to notice patterns and feel much more confident in your long-term plan. This simple habit can save you from making hasty decisions during sudden market panics.
The Psychology of Staying Calm During Market Swings
Even with the best indicators in the world, your ultimate enemy is always your own mind. When prices start falling rapidly, our natural survival instincts urge us to run away and sell. Learning to manage this emotional response is just as important as reading the charts.
Remind yourself that market volatility is a completely normal part of the long-term wealth building process. Without these price swings, there would be no opportunities to buy great assets at a discount. True investors look at market drops as clearance sales rather than disasters.
Having a written plan before the storm hits is the best way to protect yourself from your own emotions. Write down exactly what you will do if your portfolio drops by ten, twenty, or thirty percent. Having these rules in place takes the guesswork out of investing when fear takes over.

Next-Level Tactics to Protect Your Wealth During Deep Market Crashes
Managing your wealth during market storms requires more than just basic knowledge. You need a set of advanced tactics that help you remain calm when everyone else is panicking. These pro-level secrets are used by experienced wealth managers to protect capital during major downturns.
According to FINRA's investor resources[1], managing risk is the absolute base of long-term wealth building. Without a clear plan to handle downward movements, even the best portfolio can fail in a matter of weeks.
Developing an All-Weather Portfolio with Smart Asset Mixing
The first advanced strategy is to look closely at how your assets are balanced. Many people think they are diversified because they own ten different stocks, but if all those stocks are in the technology sector, you are still exposed to massive risk.
True asset mixing means holding different types of investments that do not move in the same direction at the exact same time. For example, when stock prices drop, government bonds or gold often hold their value or even rise. By spreading your money across different sectors and asset classes, you build a protective buffer that softens the blow of any market crash.
Why Cash is a Valid Investment Weapon
Many retail investors believe that keeping cash is a waste of time because of inflation. However, having a steady pile of cash during high volatility is one of the most powerful tools you can possess.
Cash gives you the emotional peace to avoid selling your long-term assets when prices drop. It also ensures you have ready capital to buy high-quality assets at deep discounts when the market finally bottoms out. Think of cash not as a lazy asset, but as an active tool waiting for the perfect opportunity to strike.
Automating Your Purchases with Rule-Based Investing
Trying to buy at the exact bottom of a crash is a game that almost no one wins. Instead of guessing, you should use a rule-based approach like dollar-cost averaging to automate your purchases.
This method means you invest a fixed amount of money at set times, regardless of whether the market is up or down. When prices are high, your money buys fewer shares, and when prices are low, your money buys more. Over time, this simple math lowers your average purchase cost and removes all emotional struggle from your strategy.
Setting clear goals is like learning how to write an academic statement of purpose because you need a clear structure to succeed. Without a solid, written plan, you will likely make impulsive choices when the market becomes highly volatile.
Using Dynamic Hedging and Protective Tools
Experienced players often use options or protective assets to hedge their portfolios against sudden downside moves. For example, buying put options allows you to lock in a minimum sale price for your assets if the market crashes. While this acts like an insurance policy that costs money, it can save you from catastrophic losses during a panic.
You can track real-time volatility indices on the official CBOE market dashboard to see when public fear is rising. This data helps you decide when it might be smart to purchase protective hedges for your investments.
How Physical Health Impacts Your Financial Choices
It is easy to forget that your body and mind are closely linked to your financial success. Stressing over every dip in your portfolio can lead to a state why you feel exhausted but cannot sleep, which ruins your health and decision-making.
When you are physically tired, your brain struggles to process risk correctly, leading to panic trades. Just like tracking what goes into your body by checking the truth about water, you must monitor what goes into your financial plan. Keeping your mind sharp relies on brain science secrets that can help you focus and make smart decisions under pressure.
Now, let us place our next graphic here to help you visualize these protective steps.
The Silent Traps That Destroy Long-Term Investment Portfolios
When market volatility increases, human emotions naturally take over the driving seat. This emotional shift often causes investors to make terrible mistakes that cost them years of hard work. Understanding these traps is the first step to avoiding them entirely.
The SEC warning on short-term trading[2] warns that trying to time fast-moving markets can lead to rapid financial losses. Despite this warning, many retail investors still fall into the same habits during a crash.
Falling into the Trap of Panic Selling
The most common mistake people make is hitting the sell button when they see red numbers on their screen. This action turns a temporary drop on paper into a permanent loss of real money. Once you sell out of fear, you lock in those losses and miss the inevitable recovery that follows.
History shows that the best trading days often happen right after the worst ones. If you are not in the market on those green days, your long-term returns will be severely damaged. Staying calm and doing nothing is often the hardest, yet most profitable, move you can make.
Chasing the Hype of Short-Term Social Media Trends
In our highly connected world, it is incredibly easy to get swept up in internet hype. People see overnight success stories on social media and feel a sudden urge to jump into highly volatile assets. This fear of missing out, or FOMO, usually leads to buying at the absolute peak of a bubble.
By the time an asset is being talked about everywhere online, the smart money has already started to sell. Joining the party late means you are likely buying from the very people who are looking to exit. Always base your choices on solid financial data rather than online excitement.
The Danger of Over-Leveraging Your Portfolio
Using borrowed money, or margin, to buy more assets can boost your gains when prices are rising. However, during times of high volatility, leverage is an extremely dangerous tool that can wipe you out in seconds.
If the price of your assets drops even slightly, your broker will demand that you deposit more cash immediately. If you cannot provide that cash, they will sell your assets at the bottom of the crash to pay back the loan. This forced liquidation can completely destroy your portfolio before you even have a chance to react.
Ignoring the Power of Hidden Fees and Taxes
Many investors trade constantly during volatile periods, thinking they are being smart and active. But every single trade you make can trigger brokerage fees and capital gains taxes. These small costs might seem minor in the moment, but they add up fast over a year.
Frequent trading often eats away a massive percentage of your total returns, leaving you with far less than a simple buy-and-hold investor. Minimizing your trading activity is one of the easiest ways to keep more of your hard-earned money. Keep your focus on long-term growth rather than short-term trades.
Failing to Keep an Emergency Cash Reserve
Another major mistake is investing every single dollar you own into the market without keeping any backup cash. If you experience a sudden personal emergency, like a medical bill or job loss, you will be forced to sell your investments to get cash. If this happens during a market crash, you will have to sell your assets at a massive loss.
An emergency fund of three to six months of living expenses acts like a shield for your investment portfolio. It ensures you never have to touch your long-term wealth to pay for your daily life. Having this safety net in place gives you the ultimate peace of mind during any economic storm.
Taking Action: Your Roadmap to Financial Resilience
Navigating the ups and downs of the financial world is a journey that requires patience, discipline, and a clear head. Market volatility is not something to be feared, but rather a normal part of the economic cycle. By tracking the key signals we discussed, you can turn scary market swings into great opportunities for wealth building.
Remember to keep your eyes on the big picture and avoid checking your portfolio every hour. Focus on what you can control, such as your savings rate, your asset mix, and your emotional responses. With the right tools and mindset, you can protect your hard-earned cash and secure a bright financial future.
Over my years of managing my own money, I have learned that the best investors are not the smartest ones, but the ones who can control their emotions. I want you to take a deep breath, write down your long-term plan today, and trust the process. You have the power to protect your wealth, and I believe you will make great choices for your future.
Common Questions About Market Volatility Indicators
What is the single most reliable indicator of market volatility?
While no single indicator is perfect, the Volatility Index, or VIX, is widely considered the most reliable tool. It measures option market activity to show exactly how much fear or confidence exists among major investors. Watching it weekly can give you a great sense of upcoming price swings.
Should I sell my investments when a market crash begins?
For long-term investors, selling during a crash is generally a poor decision because it locks in your losses. Instead, you should review your asset mix to ensure you have enough safe assets and cash. If your long-term goals have not changed, staying invested is usually the smartest path to recovery.
How often should I monitor these financial indicators?
Checking these signals once a week is more than enough for a long-term investor. Looking at them daily can cause unnecessary stress and lead to emotional trading decisions that hurt your portfolio. Set a specific day each week to spend fifteen minutes reviewing your dashboard.
Can a yield curve inversion really predict a recession?
Historically, a yield curve inversion has been one of the most accurate warning signs of an upcoming economic downturn. However, it is important to note that a recession usually does not start immediately after the inversion. It often takes one to two years for the wider economy to feel the full impact.
Is cash really a safe place to hold my wealth during volatile times?
Yes, holding a portion of your wealth in cash during high volatility is a brilliant defensive strategy. It protects your capital from sudden market drops and ensures you have money ready to buy cheap assets. Just make sure to balance your cash with assets that can beat inflation over the long run.
Disclaimer
Disclaimer: The information provided in this article is for educational and informational purposes only. It should not be considered professional financial advice. Please consult with a certified financial planner or investment advisor before making any major financial decisions.
![7 Hidden Benefits of Dollar-Cost Averaging in a Crashing Market [Step-by-Step]](https://vimex24.com/storage/uploads/blogs/1786093381_7-hidden-benefits-of-dollar-cost-averaging-in-a-crashing-market-step-by-step.webp)
![7 Proven Secrets to Master Digital Asset Taxes [Step-by-Step]](https://vimex24.com/storage/uploads/blogs/1786079646_7-proven-secrets-to-master-digital-asset-taxes-step-by-step.webp)
![5 Hidden Truths About Decentralized Finance [The Ultimate Beginner Guide]](https://vimex24.com/storage/uploads/blogs/1785857471_5-hidden-truths-about-decentralized-finance-the-ultimate-beginner-guide.webp)