
When Your Database Panics at 2 AM: The Frustrating Reality of System Slowdowns
You are just about to take the first bite of your dinner, and boom—your phone lights up with PagerDuty alerts. I know that feeling all too well. Your main database is suddenly maxed out, user requests are timing out, and you are left staring at a screen trying to figure out what broke. It is frustrating, right? Let's skip the panic and fix this mess together so you can actually enjoy your weekend.
I have sat in that exact chair, staring at flashing red status monitors while cold sweat ran down my neck. The sheer helplessness of watching an application collapse under unexpected load can ruin your week and steal your peace of mind. It drains your energy and makes you second-guess your technical skills when you cannot spot the root cause immediately.
When database query times jump from milliseconds to whole minutes, team morale plummets rapidly. Management demands immediate answers while developers scramble through millions of system log lines in panic mode. This chaos is not just a technical problem; it is a major source of burnout that steals your focus and drains your personal life.

🚀 What You Will Fix Today (In 3 Minutes):
- Kill the Zombie Queries: Why missing indexes are the number one reason your server freezes.
- Stop Over-Allocating: The simple math behind setting the perfect connection pool limit.
- Cache the Right Way: How to protect your disk storage from getting hammered by heavy read requests.
- Prevent Future Disasters: My personal checklist for setting up early warning alerts before the system crashes.
Uncovering the Root Causes Behind Sudden System Slowdowns

Databases rarely degrade in performance without a specific technical trigger hiding beneath the surface. Most performance spikes occur right after a new software deployment or an unexpected shift in application traffic patterns.
You might assume that buying bigger cloud servers will instantly clear up your performance headaches. However, throwing extra hardware at a poorly configured database merely masks underlying design flaws while burning through your operational budget.
Myth vs. Reality in System Optimization
- Myth: Adding more system memory and processor cores permanently fixes database slowdowns.
- Reality: Unoptimized database queries will consume all available memory regardless of your server size.
- Myth: Building indexes on every single column speeds up database performance across the board.
- Reality: Excessive indexes slow down data write operations and waste valuable disk storage space.
Strategy 1: Identifying Unindexed Queries and Execution Plan Changes
A single query running without a proper index can bring down an entire enterprise database cluster. As your stored records grow, full table searches that once took milliseconds suddenly take several seconds to complete.
I always begin troubleshooting by checking the system slow query logs to identify active resource hogs. You want to look specifically for data fetch requests that scan millions of rows instead of using existing index structures.
Sometimes the internal query planner unexpectedly chooses an inefficient retrieval path for specific requests. This problem usually happens when system table statistics become outdated following massive data imports or batch updates.
How Query Planners Work Under Heavy Load
The database optimizer relies on stored table statistics to estimate the cheapest way to retrieve your data. When statistics are fresh, the optimizer picks fast index pathways that fetch records almost instantly.
When statistics become outdated, the planner miscalculates costs and might default to scanning entire disks instead. Running a simple statistics refresh command on your database tables helps the engine recalculate record distributions accurately.
Updating table statistics is a quick operational fix that immediately restores optimal search paths without requiring code modifications. Make it a habit to schedule automatic statistics updates during off-peak operational hours.
Reading Query Execution Summaries
Most modern management tools allow you to inspect how your database engine processes individual requests. These summaries show you whether the system performs fast index lookups or relies on heavy sequential disk reads.
If you observe high operational cost estimates on basic filtering tasks, you need to create targeted index structures. Create composite indexes for search patterns that frequently combine multiple filtering conditions across large tables.
Expert Insight: Avoid building new indexes on live production systems during peak traffic hours. Index creation locks table records and heavy storage operations can trigger the exact outage you are trying to prevent. Always build indexes concurrently during low traffic windows.
StrategMy 30-Second Sanity Check When Things Go South:
Whenever a database freezes, I stop guessing and do these two things immediately:
- Check active connections: Are we completely maxed out? If yes, the app is probably leaking connections.
- Find the longest-running query: Usually, one terrible query is holding everything up. I find that process, kill it to restore system breathing room, and then fix the missing index.
y 2: Fixing Connection Pool Exhaustion and Thread Wait Times
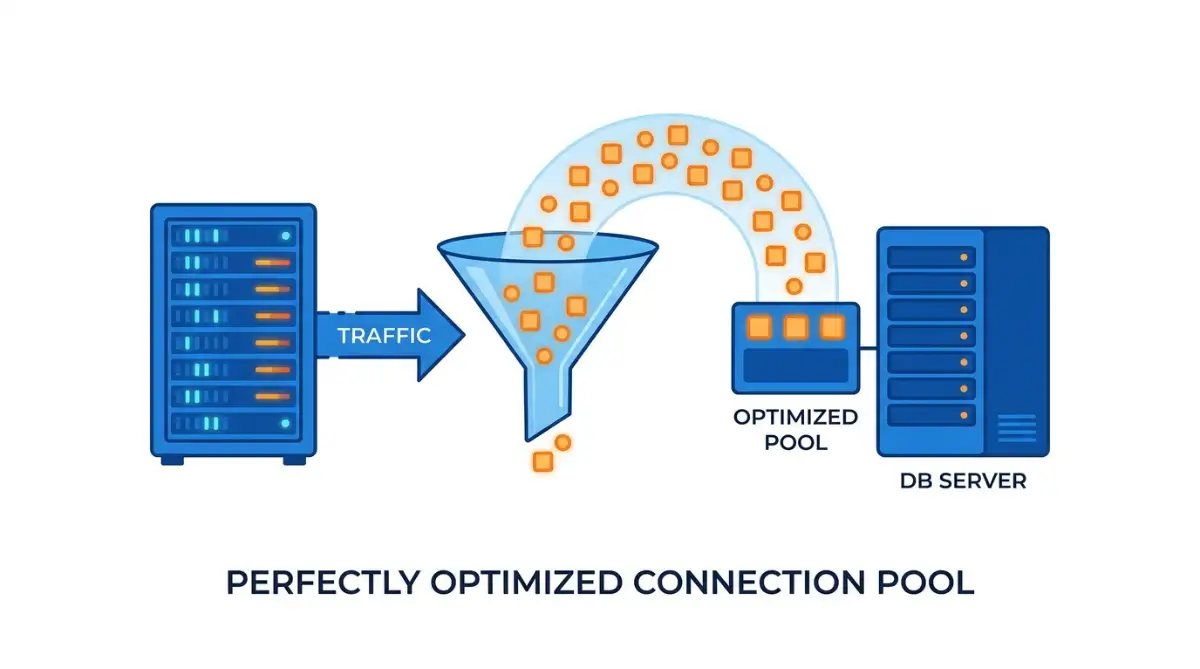
Database drivers manage active client connections through connection pools to conserve system memory. When your web application demands more connections than your database can safely accept, incoming requests queue up quickly.
This issue creates a severe bottleneck where application servers wait endlessly for open database sockets. Web pages load slowly until your application server runs out of operational memory and crashes.
Setting connection pool limits too high is a common mistake that many software teams make during scaling efforts. A database server handling hundreds of active concurrent connections spends more energy switching worker contexts than executing requests.
Finding the Balance for Connection Limit
Calculate your ideal connection limit based on your available CPU processor cores and storage throughput. A simple baseline formula works well for most modern server architectures:
For example, a modern cloud server with eight CPU cores and two solid-state drives needs around eighteen active connections. Keeping your connection pool lean forces queries to finish faster because the underlying hardware runs with less context-switching overhead.
Configure short connection timeout thresholds inside your application configuration files. Short timeouts force failing operations to fail fast instead of holding database sockets open indefinitely.
Strategy 3: Resolving Row Locks and Transaction Blockers
Long-running transactions hold tight locks on database rows and prevent other operations from modifying data. When multiple application threads try to update the exact same record, a large processing queue forms behind the first request.
I once investigated a production system where an unclosed database transaction held a row lock for twenty minutes. Hundreds of incoming user actions queued up behind that single thread until the primary database server ran out of memory.
Keep your database transactions as brief as possible to avoid lock escalation across your storage system. Complete all complex business calculations in application memory before opening a database write operation.
Breaking Locking Loops and Transaction Bottlenecks
Deadlocks happen when two separate database transactions wait on records locked by each other. Most relational database engines detect deadlocks automatically and terminate one of the competing queries with an error notification.
To prevent frequent deadlocks, always execute update statements in the exact same sequence across all your software services. Consistent record access patterns eliminate locking loops and keep data moving smoothly without manual intervention.
Review your database transaction isolation settings to ensure you are not using unnecessarily strict locking modes. Using standard read-committed isolation instead of serializable mode often solves locking issues while maintaining strict data correctness.
Here is a quick breakdown of how isolation levels actually impact your server speed:
Strategy 4: Using Memory Caching to Prevent Database Overload
Routing every single user read request directly to your primary database disk is a quick recipe for system downtime. An in-memory cache layer placed in front of your database absorbs heavy read traffic and protects your storage hardware.
However, caching brings new challenges when hundreds of incoming requests try to update an expired memory key simultaneously. This scenario is called a cache stampede, and it can crash a database cluster in seconds.
Use random cache expiration windows or background refresh workers when updating key values in memory. These techniques prevent thousands of requests from hitting your database at the exact same moment when keys expire.
Architectural Trade-offs for Database Performance
Strategy 5: Eliminating Storage Bottlenecks and High Disk Read Latency
When queries read massive datasets from physical disks, your storage controllers become the primary performance bottleneck. High disk read latency forces your central processor to pause while waiting for raw data retrieval.
Check your server dashboard metrics to measure active input and output storage queues. If your disk queue length stays consistently high, your storage drive configuration is under heavy operational stress.
Expand your database memory buffer allocations so that frequent operational data remains cached in main system memory. When hot data lives directly in RAM, your database engine stops making slow physical disk reads.
If adding system RAM is not an option, split historical log tables into separate archive storage volumes. Archiving inactive historical data keeps your active transactional tables lean and extremely responsive.
Strategy 6: Setting Up Early Warning Systems to Prevent Crashes
Fixing performance issues after your production platform crashes is always stressful and expensive. You need early warning monitoring tools to alert your team before minor database slowdowns turn into total system outages.
Track core performance indicators like active connection counts, secondary node replication lag, and memory cache hit percentages. Setting automated warnings at eighty percent resource usage gives your team ample time to resolve issues calmly.
Configure automated log parsers to flag any query taking longer than two hundred milliseconds to finish. Catching inefficient queries early during development prevents massive performance failures on live production systems.
Mastering Pro-Level Systems Tuning for Lasting Reliability
Resolving an active database emergency is only the first step toward building a resilient system architecture. To prevent performance spikes from recurring, you must implement proactive maintenance habits that protect your database long before user traffic hits peak levels.
I spent years reacting to production fires until I realized that systematic maintenance prevents ninety percent of all sudden performance drops. Shifting your team from reactive bug fixing to proactive system care keeps your database fast and reliable month after month.
Moving from emergency troubleshooting to planned system health checks transforms how your team operates. Instead of late-night firefighting, developers focus on building new features while database response times stay consistently fast.
Implementing Partitioning for Rapid Data Access
When database tables grow beyond tens of millions of records, standard search indexes lose efficiency. Table partitioning solves this problem by dividing massive tables into smaller, highly manageable physical chunks based on logical ranges.
For example, you can partition transaction records by month or quarterly periods so your engine scans only relevant storage segments during searches. This targeted access drastically cuts down disk operations and speeds up complex reporting queries across large applications.
When historical data is partitioned, deleting old records becomes an instantaneous file system operation rather than a slow database write loop. Removing expired partition files frees up valuable disk space immediately without creating table locks that freeze your application.
Partitioning also simplifies database backups and maintenance routines for enterprise applications. Engineering teams can back up or index specific active partitions without touching terabytes of historical cold data.
Automating Vacuuming and Index Defragmentation
Relational databases that process frequent updates and deletions accumulate internal bloat over time. Dead records remain inside table files and clutter storage space, forcing the database engine to search through empty pages.
Configuring automated background vacuuming ensures dead records are cleaned up continuously without impacting live user traffic. Regular vacuuming reclaims unused disk space and updates system catalog statistics so the query planner keeps picking optimal execution paths.
In addition to table vacuuming, index fragmentation must be monitored and corrected periodically across your storage cluster. Rebuilding bloated indexes in the background restores compact tree structures and keeps search speeds blazingly fast.
Continuous maintenance prevents the slow performance degradation that typically creeps into systems over months of heavy usage. Establishing automated cleanup routines ensures your storage layer performs like new even as user numbers grow.
Questions Engineers Ask About Database Longevity
How often should we review slow query logs?
You should review slow query logs at least once every week during regular maintenance cycles. Setting up automated notifications for any query exceeding two hundred milliseconds helps you catch performance degradation long before customers complain.
When is the right time to add read replicas?
Add read replicas when your primary database CPU utilization stays consistently above sixty percent due to read queries. Offloading heavy reporting tasks and search queries to secondary nodes keeps the main database free to handle fast write transactions.
Can we rely entirely on automated memory tuning?
Automated memory allocation works well for small workloads, but enterprise databases require manual fine-tuning. Adjusting buffer sizes, query memory limits, and thread caches based on real workload patterns delivers far better stability.
Practical Do's and Don'ts for System Health
- DO schedule index maintenance and statistics updates during low-traffic maintenance windows.
- DO implement strict connection pool limits on every application server connected to your cluster.
- DO review official developer resources like PostgreSQL Official Documentation to verify configuration parameters before applying changes.
- DON'T run untested schema modifications directly against live production tables without testing on staging environments first.
- DON'T leave unused database indexes active on high-write tables where they drag down write performance.
- DON'T grant application services full root database privileges when restricted user accounts are safer.

Critical System Pitfalls That Ruin Performance and Burn Budgets
When database systems slow down, engineers often act on impulse and make knee-jerk changes under pressure. Frantic adjustments made without proper diagnostic data frequently turn minor slowdowns into catastrophic cluster outages.
One major mistake is blindly restarting database servers whenever CPU usage hits maximum capacity. While restarting clears active query queues temporarily, the exact same unoptimized queries will instantly flood system memory the moment traffic returns.
Restarting a database also wipes out its warm memory cache, forcing every subsequent request to pull data directly from slow physical disks. This cold cache effect creates a massive performance penalty that worsens server stress for hours afterward.
Over-Indexing and the Hidden Cost of Write Latency
Another common pitfall is creating a new index for every slow query that shows up in your monitoring dashboard. While indexes accelerate read queries, every additional index forces the database engine to write extra data during inserts, updates, and deletes.
Having too many indexes turns fast write operations into slow, multi-disk update tasks that clog your transaction processing pipeline. Strive to build versatile composite indexes that serve multiple query patterns instead of creating dozens of single-column indexes.
Always consult trusted engineering standards such as the MySQL Optimization Reference to structure efficient table layouts. Balancing read optimization with write speed is essential for long-term platform health.
Carefully evaluating query usage before building new indexes protects write throughput across high-traffic platforms. Removing redundant indexes is often the fastest way to restore swift database write speeds.
Financial Stress and Operational Cloud Overruns
Unexpected database bottlenecks often force companies to scale up cloud hardware size in panic mode. Escalating server costs can quickly drain team budgets and create severe financial pressure on growing businesses.
Engineering managers who overspend on oversized hardware often face difficult conversations with executive leaders. Learning to optimize code before buying extra hardware saves company resources, similar to how business owners choose to secure a bank loan without collateral to keep operations running smoothly without risking primary assets.
When emergency budget expansions become necessary to keep web applications online during traffic spikes, speed matters. Exploring flexible funding solutions resembles searching for instant approval loans for emergency needs when timing is everything.
Modifying Live Configurations Without Load Testing
Changing database configuration parameters directly on production nodes without prior testing is a dangerous gamble. Increasing global buffer sizes without calculating total server RAM limits can trigger operating system memory kills that terminate your database process instantly.
Always test parameter adjustments in a staging environment that mirrors your production dataset size and query volume. Validating changes under simulated user traffic ensures your system handles peak loads gracefully.
Following established industry patterns like those outlined in Martin Fowler's Software Architecture Principles helps build predictable software deployments. Systematic testing prevents surprise configuration errors and protects user trust.
Never assume that a setting working well on small development laptops will behave identically on multi-core production servers. Thorough benchmarking isolates configuration weaknesses long before real customers encounter errors.
Your Action Plan for Tomorrow: Building Rock-Solid Database Resilience
Resolving database performance bottlenecks does not require magic or expensive third-party tools. By applying targeted indexing, tuning connection pools, and caching hot data, you can transform a fragile system into a fast platform.
Take control of your database environment today by selecting one problem area to investigate and optimize. Start by running a slow query log audit or reviewing your connection pool limits during your next engineering session.
Every small improvement you make reduces processor strain, improves response speeds, and protects your platform from unexpected crashes. You now possess the practical knowledge required to maintain a blazingly fast database system that scales with confidence.
Building resilient software infrastructure is a continuous journey of learning, monitoring, and refined engineering. Start making your first optimizations today, and enjoy the peace of mind that comes with a rock-solid production environment.
Disclaimer & Compliance Notice
This article is provided for educational and informational purposes only. Database optimization strategies, configuration settings, and architectural recommendations should always be thoroughly tested in non-production staging environments before implementation on live systems. The author and publisher accept no liability for system downtime, data loss, or financial impact resulting from the application of these techniques. All brand names, software titles, and external links mentioned belong to their respective trademark owners.